By: Bob Morse
How do you tell if a product is truly great? Customer testimonials, product demos, revenue growth, and input from industry experts all offer information—but data from those sources can often be contradictory.
What is the best data point we can rely on, particularly in these times of macroeconomic uncertainty, to get to the heart of the matter?
At Strattam, we have found that the single best metric is gross dollar retention. This metric reveals exactly how mission-critical a product is to its users. In addition, this metric drives valuations, as it directly influences both operational efficiency and growth potential.
What do we mean by gross dollar retention?
Let’s start by defining the key terms. At Strattam, we use this definition:
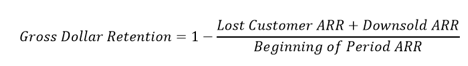
“Lost Customer ARR” is about customers who leave. “Downsold ARR” is about customers who are dissatisfied or reluctant to stay. Both reveal weaknesses in a recurring revenue business. We want a metric that allows the information about revenue quality to come through. We do not want other offsetting information, such as price increases or upsells, to hide data about leaving or dissatisfied customers.
“Beginning of Period ARR” is the recurring revenue at the beginning of the period for which you are measuring churn (annual, quarterly, etc.). The Lost Customer ARR and Downsold ARR are measured in the same period, from decreases due to customers leaving, or customers paying less (whether because they receive a discount or are purchasing a reduced offering), respectively.
If this metric seems like it just takes into account the bad (departures and discounts) and excludes all the good (upsells and price increases)… well, exactly right! That is the whole point. We want to “turn one dial at a time,” as a mentor of mine often says. Here’s why:
Healthy subscription businesses depend customers staying and paying in full and on time. The measurement problem arises because pretty much all subscription businesses we meet claim they are healthy, and to make that claim, the ones with weaker gross dollar retention will instead report customer retention in other ways. They might report a measure based on customer count. Or they might report something called “net retention,” which adds the benefit of upsells and price increases. Those metrics, while valid and something we consider, obscure the health of the current revenue base. (And don’t get me started on “pro forma adjusted net retention.”)
What’s so special about gross dollar retention?
We prefer this metric over others for several reasons:
– It captures downsells (for instance, offering a customer a big discount to renew), which are not captured in customer count churn. Why do downsells matter? Consider this: You may have been able to retain all your customers, but if you had to offer huge discounts to do so, do they really love your product? Probably not.
– This metric also excludes the impact of upsells to existing customers, which are included in net dollar retention. This matters because net retention, while helpful in evaluating a company’s effectiveness at a “land and expand” strategy, is less helpful in assessing product quality and stickiness, and can therefore mask underlying problems.
For example, consider two businesses, both selling the same kind of product to the same kind of customer base. Both accurately report 100% net retention. But, one has gross retention of 95%, and the other has gross retention of 70% and uses upsell and price increases that make up the difference. I would argue there is substantially more risk in the longevity of the 70% gross retention business’s customer base —and the valuation multiple of that business, all else equal, should be lower than that of the 95% gross retention business.
Pay attention to customer base
When looking at gross dollar retention for purposes of evaluating product quality and “mission criticality,” it is also important to take the nature of the company’s customer base into account. Why? Consider two companies with equally compelling and valuable solutions, but one sells to an SMB customer base and the other sells to large enterprises. In this scenario, the one selling to SMBs will likely have lower gross retention simply because more of their customers are disappearing, either because they go out of business or because they are acquired. In other words, the highest possible gross retention rate is equal to 1 – the mortality rate of customers in your customer base.
A comparison from two actual companies in the Strattam portfolio may help illustrate. One company, which we’ll call SmallCo, tends to sell to small and medium business (SMB) customers that are typically manufacturers or distributors with $10-$500M in revenue. According to a study[1] conducted by the Washington D.C. Federal Reserve Board, the percentage of businesses with 20 – 500 employees (a decent proxy for SmallCo’s customer base) that went out of business each year averaged around 4% for the 30 years leading up to the pandemic. This compares to approximately 1% for companies with more than 500 employees, which is a better proxy for the customer base of our other portfolio company (“EnterpriseCo”). Both SmallCo and EnterpriseCo have high-quality and very sticky products, so based on this data, we would expect EnterpriseCo’s gross retention rate to be roughly three percentage points (4% – 1%) higher than that of SmallCo. As the chart below shows, this is exactly what we observe. Since December 2020, EnterpriseCo’s gross retention rate has averaged 93% and SmallCo’s has averaged 90%.
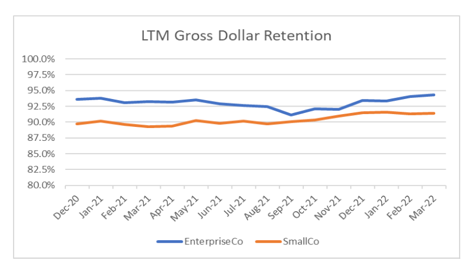
The difference in retention rates between the two companies is explained entirely by the difference in mortality rate of their respective customer bases. Said differently, customers love each product equally[2], despite the difference in the absolute gross retention figure. Paying attention to the customer base matters when comparing gross retention across companies.
Gross retention drives valuations, too
Gross dollar retention doesn’t just indicate how mission-critical a solution truly is. We also focus heavily on this metric because it has a powerful compounding effect in SaaS models and is therefore a meaningful driver of valuations.
To illustrate this point, here is one more compare and contrast example (last one, I promise!). Let’s look at two hypothetical companies that both start with $20M of ARR, book $5M of ARR each year over the next five years, and have 20% EBITDA margins. The only difference between the two is that one company—we’ll call it “High Retention Company”—has 95% gross retention, and the other— “Low Retention Company”—has 85% gross retention. Now, 85% gross retention is really more “so-so” than “low,” but let’s see whether even this ten percentage-point difference in gross retention matters very much. While in reality, these two businesses would not garner the same valuation at entry, to keep the analysis simple, we will assume that they are both acquired for 5.0x ARR, or $100M. To make the example more realistic from an equity returns perspective, let’s also assume that both acquisitions are funded by $70M of equity and $30M of debt.
After five years, as summarized in the chart below, High Retention Company will have ARR that is approximately 40% higher than that of Low Retention Company and will have generated approximately 40% more free cash flow as well. That’s because retention rates don’t just impact revenue growth over time—they also have big operational impacts that make it difficult to run a high-margin business when retention is low. How big? In order for Low Retention Company to achieve the same ARR as High Retention Company at the end of our five-year period, it would have to book $8.25M per year instead of $5.0M. That’s a 65% increase! That’s 65% more leads that need to be generated, 65% more sales reps that need to be hired, 65% more implementations that need to be completed… you get the picture.
And it doesn’t stop there. If we assume that both businesses are sold at the same ARR multiple after five years, High Retention Company would be worth about 40% more than the Low Retention Company, and returns to equity investors would be around 50% higher. If we’re really being sticklers, the return disparity could actually be even larger, since High Retention Company would support more leverage and sell at a higher ARR multiple. Granted, this is a simplified example, but it does demonstrate the importance of retention on valuation. All else equal, every 1% of increase in gross retention implies a 5% or greater increase in enterprise value.
We aren’t the only ones who think this way. One of our closest senior lending relationships uses gross retention as a go/no-go decision threshold. If gross retention is less than 88%, they will not even consider a loan. Trust me: When you find the metric senior lenders use to make underwriting decisions, it conveys that data point has a very high signal-to-noise ratio.
We believe gross retention is a hard-nosed metric that says a lot about the quality and value proposition of a company’s products and is, therefore, a meaningful driver of value. As such, we use this metric in triaging all new businesses we evaluate, and we keep it front and center with our leadership teams as a high-priority KPI to focus on as our businesses grow. It’s a solid foundation to stand on in these uncertain times.
[1] Crane, Leland D., Ryan A. Decker, Aaron Flaaen, Adrian Hamins-Puertolas, and Christopher Kurz (2021). “Business Exit During the COVID-19 Pandemic: Non-Traditional Measures in Historical Context,” Finance and Economics Discussion Series 2020-089r1. Washington: Board of Governors of the Federal Reserve System, https://doi.org/10.17016/FEDS.2020.089r1
[2] Which here means the gross dollar retention from customers still in existence is the same for both companies.